When it comes down to browser performance, Microsoft has done a wonderful job with Edge because it is one of the fastest out there on Windows 11 computers. But despite that, the company is not slowing down on its quest to ensure Microsoft Edge is always at the forefront of performance.
A recent blog post suggests the software giant is changing how Microsoft Edge processes appear in the Windows Task Manager to make it easier for users to understand why their browser has slowed down. This is great news because a lot of folks find it very frustrating when they’re unable to understand what’s happening with their computer. Microsoft has made some key changes to how Edge is represented in the Task Manager. These changes are currently available to Insiders who are self-hosting Windows 11 but must be using Edge 94 Stable release.
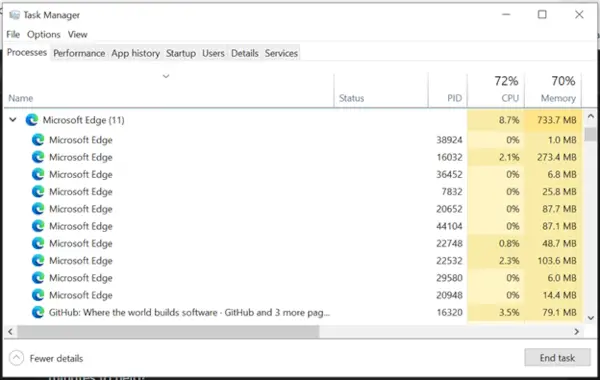
The overall goal here, as we’ve suggested, is to make it easier for users to better understand where your compute resources are going so, they can make the right decisions to improve performance. So, at the moment, if you open the Task Manager and navigate where Microsoft Edge processes are shown, things should look as follows:

Obviously, that’s the old way of doing things, and to be honest, it has always been quite confusing. However, with the new changes made, users should now see more detailed information on each Microsoft Edge process.
Microsoft improves the appearance of Edge processes in Windows 11 Task Manager
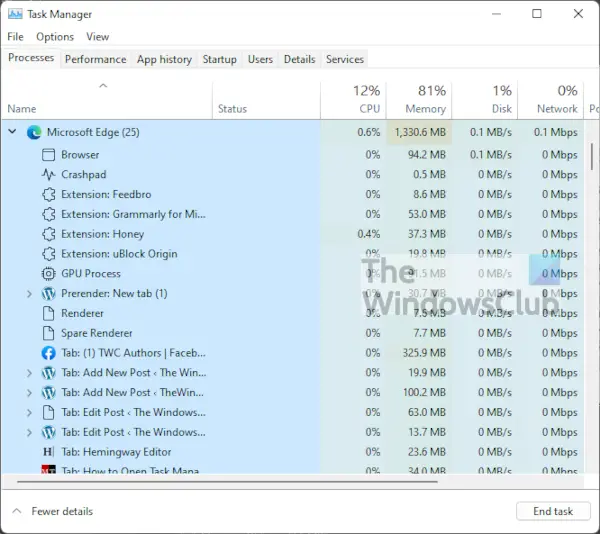
By looking at the screenshot below, you should get an idea of the changes made and how better this version is when compared to the old:

As you can see, it is now easier to tell which tab is using the most system resources, therefore, much easier to take action without having to worry about making a mistake.
What the improvements include
- For the browser process, GPU process, and crashpad process, you will see the process type with a descriptive name and icon (such as “Browser,” “GPU Process,” or “Crashpad.)
- For the utility, plug-in, and extension processes, you will see the process type and the name of the service, plug-in, or extension.
- For renderer processes:
- For tabs, you will see the word ‘tab’, and the site name and icon (Note: For InPrivate tabs, site name will be removed and the icon will be updated to a default tab icon)
- For subframes (typically used for ads), you will see the word ‘subframe’, followed by the subframe’s URL
- All dedicated workers and service workers will be listed
Identifying single items in a process
OK, for those who want to identify a single item in a process, just know that items that relate to one process do not have an arrow next to the icon. Whenever you click on this item, only a single line is highlighted. Furthermore, each line has its own resource usage.
Identifying multiple items sharing a process
When you see an arrow next to an icon, that indicates the particular item shares a process with another. If you look at the end of the title, then, you should see a number in parentheses indicating the number of items that share the same process. By clicking the arrow, you will expand the process to view more information.
Bear in mind that because multiple items share the same process, the item that has the arrow next to it will always showcase the total resource usage for all combined.
How to open the Task Manager in Windows 11
Opening the Task Manager in Windows 11 is a bit different when compared to previous versions of the popular operating system. For example, it is no longer possible to right-click on the Taskbar to select the Task Manager.

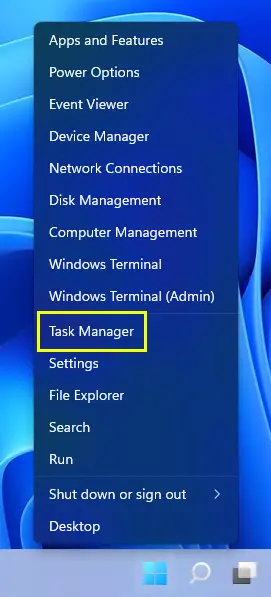
You can either right-click on the Windows button on the Taskbar, then select Task Manager from the context menu, or press Ctrl + Shift + Esc via your keyboard.
Alternatively, you could simply click on the search icon, then type Task Manager, and from there, select it from the search results.