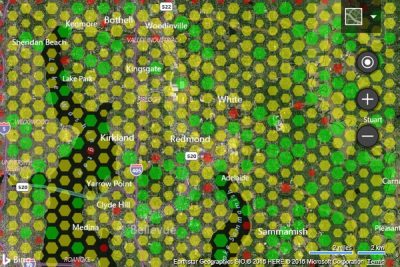
The regular update for Bings Maps Version 8 Developer Control now comes with new data visualization features which will help you deduce the business data in a much better way. Data binning is a process in which point data are grouped into a symmetric grid of geometric shapes and an aggregated value is then calculated from the pins in a bin and eventually set to the color or scale of the bin. All of this is done in order to get a visual representation of a data metric contained by the bin.

During the binning process if hexagons are used it is called hex binning. As the size and the color both can be customized to arrive at an aggregate value it is possible to let a single data bin represent two data metrics (bivariant). The binning module further makes it easy to create data bins from several pushpins.

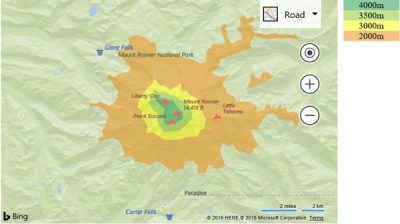
Contour Module is yet another visualization method that is popular. The contour lines are lines that connect all the points which share an equal value. These are often used to visualize data including elevations, temperatures, and earthquake intensities all spread over a 2D map. It is also easy to view and visualize the contour line data on the Bing Maps. The elevated areas are marked on the Bing maps as non-overlapping areas.
Also, the TypeScript Definitions for the Bing Maps V8 has been updated to include September updates and also made the definition’s available through npm. If you are looking out for details, a complete set of new features is recorded in the MSDN documentation. In case you have any suggestions or feedback about the V8 update you can let Microsoft know on its Bing Maps forums.
More at the source.
Leave a Reply