GeoFlow for Excel 2013 was announced a few days back. While earlier in Nov 2012, the attendees of SharePoint Conference 2012 had received it, this is a Public Preview and will be integrated with Microsoft Excel 2013 later this year. GeoFlow is a project codename and it is a new 3D data-visualization add-in for Excel providing a powerful method to look at information in new ways. It lets you plot geographic and temporal data visually, analyze that data in 3D, and create visual tours that can be shared with others.
It’s a result of collaborations between several teams within Microsoft.
“GeoFlow originated in Microsoft Research, evolving out of the successful WorldWide Telescope project for scientific and academic communities to explore large volumes of astronomical and geological data. Researchers collaborated closely with the Office product team to usher GeoFlow from its research lab inception to this public preview availability in Excel.”
GeoFlow for Excel 2013
With GeoFlow, you can:
- Map Data: Plot more than one million rows of data from an Excel workbook, including the Excel Data Model or PowerPivot, in 3D on Bing maps.
- Discover Insights: Discover new insights by seeing your data in geographic space and seeing time-stamped data change over time. Annotate or compare data in a few clicks.
- Share Stories: Capture “scenes” and build cinematic, guided “tours” that can be shared broadly, engaging audiences like never before.
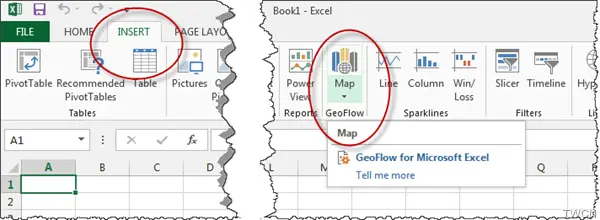
After installation , this can be accessed from Insert Menu.

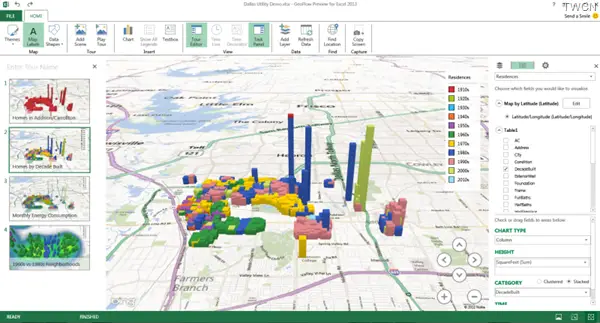
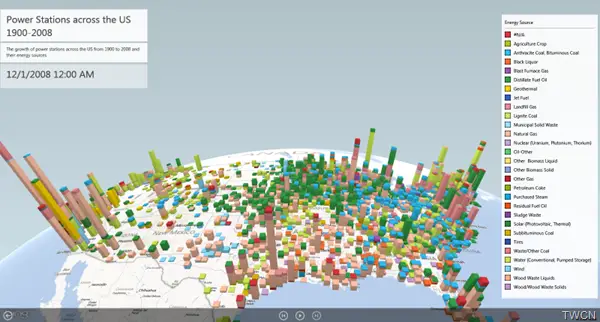
Here are few screenshots


Also please check the system requirement for using this Add-in. This works only with Office 365 ProPlus or Office Professional Plus 2013. You also need to be connected to the internet to use GeoFlow.
You can download Geoflow from here. It includes the ‘Getting Started with GeoFlow Preview’ document. You can also download Sample file to try GeoFlow from here. This link also provides more details of how to build the demo.
Here is a small demo video of GeoFlow:
http://youtu.be/LNI0r9_BJUM