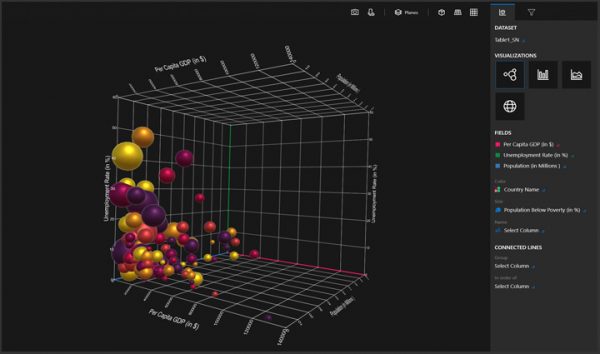
Microsoft Garage has been the treasure cove of innovation. The impromptu platform by Microsoft has been helping its employees come up with innovative and outlandish ideas that often end up as a core Microsoft offering. Microsoft Garage has once again come up with a new offering titled “Charts 3D.”

Charts 3D from Microsoft Garage
Needless to say, most of you might have already guessed. Yes, the Charts 3D is an empowering tool aimed at helping creators and storytellers come up with better visualization. The 3D Charts is also expected to add an intuitive touch to an otherwise boring Charts. The folks at Microsoft believe that Charts and other statistics have mostly served as a one-way communication of conveying information. With intuitive 3D Charts perhaps it will be relatively easier for facilitating two-way communication.
The Charts 3D is the brainchild of a small group of innovators based out of Hyderabad and belonging to Microsoft India Development Center. The Garage teams are mostly involved in giving a new and innovative spin to old products that have been gathering dust. As per the blog post the team was fascinated by data storytelling and has used some concepts from Mixed Reality to come up with Charts 3D.
This is what the Microsoft team had to say-
“Excel and PowerPoint have lots of amazing features that help you build rich and beautiful charts. However, we kept hearing feedback that when data gets really complex, users often struggle to decide which chart will be best to visualize the data and land the insight.” He further added that “People would identify these great insights but then find it difficult to show them to others in a presentation.”
Microsoft Office will be able to use layer two datasets on top of each other across Excel or Powerpoint. They can also create a two-dimensional graph with two “Y” axes which is used to illustrate the different set of data. Microsoft touts the Charts 3D as something that will help draw parallels between data crunching and data storytelling.
Leave a Reply