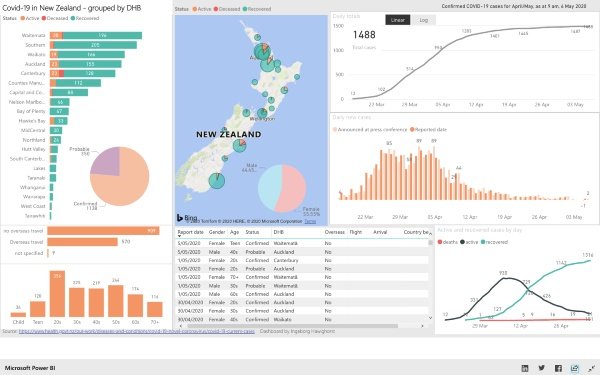
Wait, what? Creating a COVID-19 tracker using Microsoft Excel? Is that even possible? Believe it or not, an eight-time Microsoft MVP awardee, Ingeborg Hawighorst has managed to create her COVID-19 dashboard that visualizes the number of active and recovered cases in New Zealand, with the help of Microsoft Excel.

COVID-19 dashboard using Excel & Power BI
Hawighorst has published a 45-minute video explaining in detail how she managed to pull off her COVID-19 dashboard using Microsoft Excel. Meanwhile, you can check out her video if you are looking to create your Do-It-Yourself (DIY) Microsoft Excel-based coronavirus dashboard.
In her recent blog post, Hawighorst wrote:
“With the ever-changing data sources, I ran into quite a few challenges and had to come up with some workarounds.”
Similar to how all COVID-19 tracking apps and websites rely on official sources for information related to the number of active and recovered cases, Hawighorst pulled the data from the New Zealand Ministry of Health website. Due to the dynamic nature of the COVID-19 data, Hawighorst had to update her queries almost daily.
“I also kept an Excel spreadsheet as a data source, where I kept track of some numbers that were not available in that form on the web site.”
Later on, she created a map chart in Microsoft Excel to show the numbers for each New Zealand region using color shading. But that was not a simple task since the map needed to go through a lot of changes to be integrated into a final dashboard.
“The source data required a lot of cleaning up and massaging in Excel’s Power Query, but I finally got a usable map and arranged a few charts around it.”
After the Ministry of Health changed the reporting units to grouping by District Health Boards, Hawighorst had to switch to Power BI, a data visualization service by Microsoft, which allowed her plot points on the map instead of regions. The service also allowed her to make the dashboard publicly accessible on the internet.
“I could re-use the Power Query code from Excel in Power BI, so the online version was configured very quickly.”
Once the technical part was taken care of by Microsoft Excel and Power BI, Hawighorst only had to perform query adjustments daily as the Ministry of Health changed table positions, table structure, column names, etc.
Ingeborg Hawighorst’s COVID-19 dashboard is available here.
Leave a Reply